Page History
Audit Logs
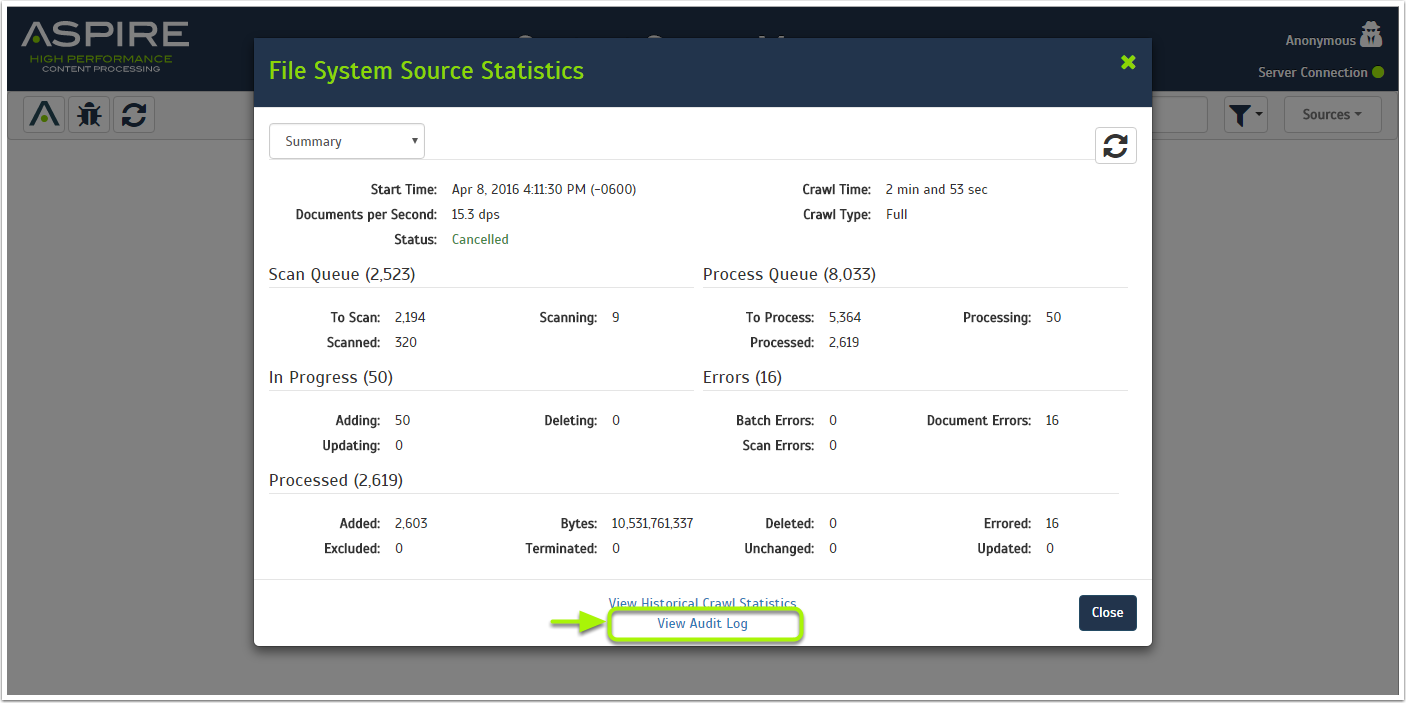
You can look in better detail at which actions were performed by each of the Content Source scanners.
In order to access the audit logs, open the statistics pop-up and click View Audit Logs as shown.
Related pages:
Top Bar Audit
Most of the functionality for the Auditing section can be found in the top bar.
Functionalities
- Aspire Logo
- Normally is a link to the Home page, depending of the section. For Manager, it does nothing.
- Current Content Source
- Displays the icon of the connector type and the name of the content source.
- Current User
- Indicates the current user logged in.
- Server Connection
- Indicates the speed of the connection between the browser and the server.
- GREEN: Less or equal to two seconds (>= 2s)
- YELLOW: From two to 4 seconds (< 2s and >= 4s)
- ORANGE: Higher than 4 seconds (< 5s)
- RED: No response from the server
- Indicates the speed of the connection between the browser and the server.
- Home
- A link to the Home page (Content Source Manager).
- Aspire Wiki
- Opens a new tab to the wiki.
- Debug Console
- Access Aspire Debug in a new tab.
- Refresh
- Reloads just the content sources, without reloading the whole page.
- Compare
- Provides a way to compare this audit log against an index dump from your search engine.
- Log Type
- Filters out the logs using its type, the available types are: job (job related actions) and batch (batch related actions).
- Log Action
- Filters out the logs by its action
- Page Size
- Select how many logs are going to be displayed on each page
- Directory
- Access other sections of Aspire (Service, OS License, Developer tools, Servers and About.)
- Access other sections of Aspire (Service, OS License, Developer tools, Servers and About.)
Auditing Display
All logs for the auditinig log will be identified with a number Id and the date for each log
- Paging
- Paging allows you to move more quickly between pages and move from the oldest log to the newest with just one click.
Overview
Content Tools