Enable the Performance Reports
In order to be able to get the Performance Reports, we need to enable the Performance Statistics flag in Aspire which is by default disabled. To enable/disable this flag you need to:
- Go to the Debug Console and then click on the Performance Statistics section.

- Click enable.

- Go to http://localhost:50505/aspire/YOUR-CONTENT-SOURCE-NAME/PerformanceLogger and click on enable.

When both System Performance Statistics flag, and Performance Logger Component are Enabled you can start your crawls and it will be logging its performance information automatically.
How does it work?
When the Performance Statistics flag is enabled, every stage, pipeline, workflow rule, etc., will log its processing time into each job inside an AspireObject.
You can get this AspireObject by calling job.getPerformanceStatistics().
You can not get the entire AspireObject with the statistics from within a stage, pipeline or workflow rule, since that method will return the nested AspireObject holding the statistics just for that component. DO NOT perform any pop() or popAll() on that AspireObject since it can corrupt the whole statistics stack logic. The only safe place to get the statistics is from a the job listeners once the job has finished. (See Job Listeners for more information about Job Listeners).
Example: Having the following application.xml file:
<application name="PerformanceStatisticsExample">
  <components>
    <component name="StandardPipeManager" subType="pipeline" factoryName="aspire-application">
      <components>
        <component name="FetchUrl" subType="default" factoryName="aspire-fetch-url" />
        <component name="ExtractText" subType="default" factoryName="aspire-extract-text" />
        <component name="ExtractDomain" subType="default" factoryName="aspire-extract-domain" />
        <component name="PrintToFile" subType="printToError" factoryName="aspire-tools">
          <outputFile>log/${app.name}/exampleDebug.out</outputFile>
        </component>
      </components>
      <pipelines>
        <pipeline name="doc-process" default="true">
          <stages>
            <stage component="FetchUrl" />
            <stage component="ExtractText" />
            <stage component="ExtractDomain" />
            <stage component="PrintToFile" />
          </stages>
        </pipeline>
      </pipelines>
    </component>
  </components>
</application>
When a job processes that application the following information will be generated:
 <performanceStatistics name="root" process="true">
  <stats>
    <startTime>2014-08-19T22:27:57Z</startTime>
    <endTime>2014-08-19T22:28:08Z</endTime>
    <processingTime>10927</processingTime>
  </stats>
  <pipelineManager name="/PerformanceStatisticsExample/StandardPipeManager">
    <stats>
      <startTime>2014-08-19T22:27:57Z</startTime>
      <endTime>2014-08-19T22:28:08Z</endTime>
      <processingTime>10926</processingTime>
    </stats>
    <pipeline name="doc-process">
      <stats>
        <startTime>2014-08-19T22:27:57Z</startTime>
        <endTime>2014-08-19T22:28:08Z</endTime>
        <processingTime>10926</processingTime>
      </stats>
      <stage name="/PerformanceStatisticsExample/StandardPipeManager/FetchUrl">
        <stats>
          <startTime>2014-08-19T22:27:57Z</startTime>
          <endTime>2014-08-19T22:28:02Z</endTime>
          <processingTime>5595</processingTime>
        </stats>
      </stage>
      <stage name="/PerformanceStatisticsExample/StandardPipeManager/ExtractText">
        <stats>
          <startTime>2014-08-19T22:28:02Z</startTime>
          <endTime>2014-08-19T22:28:08Z</endTime>
          <processingTime>5330</processingTime>
        </stats>
      </stage>
      <stage name="/PerformanceStatisticsExample/StandardPipeManager/ExtractDomain">
        <stats>
          <startTime>2014-08-19T22:28:08Z</startTime>
          <endTime>2014-08-19T22:28:08Z</endTime>
          <processingTime>0</processingTime>
        </stats>
      </stage>
      <stage name="/PerformanceStatisticsExample/StandardPipeManager/PrintToFile">
        <stats>
          <startTime>2014-08-19T22:28:08Z</startTime>
          <endTime>2014-08-19T22:28:08Z</endTime>
          <processingTime>0</processingTime>
        </stats>
      </stage>
    </pipeline>
  </pipelineManager>
</performanceStatistics>
Note that the processing time of a parent node is the sum of its children, sometimes it also gets an overhead besides the children's sum. The processingTime is given in milliseconds, if it is 0, it means it took less than 1 millisecond to process, because it doesn't handle smaller time units than milliseconds.
Download the Performance Reports
As mentioned above, you have to enable the PerformanceLogger component to start logging performance statistics. This is the component which logs the statistics for each document and also computes the averages of the processingTimes for the same execution paths (more than one job with the same execution path) and let you download the report of the logged execution paths in XML or CSV format. That component also logs into a file all the Performance Statistics that it got from every job sent to it.
An execution path is the ordered list of applications, pipelines, stages and workflow rules in which each document was processed. There can be different execution paths for documents scanned from the same connector, this is because there can be different processing rules for different types of documents (such as Folders/Files). You can also create new execution paths by adding some flow control rules to your workflow.
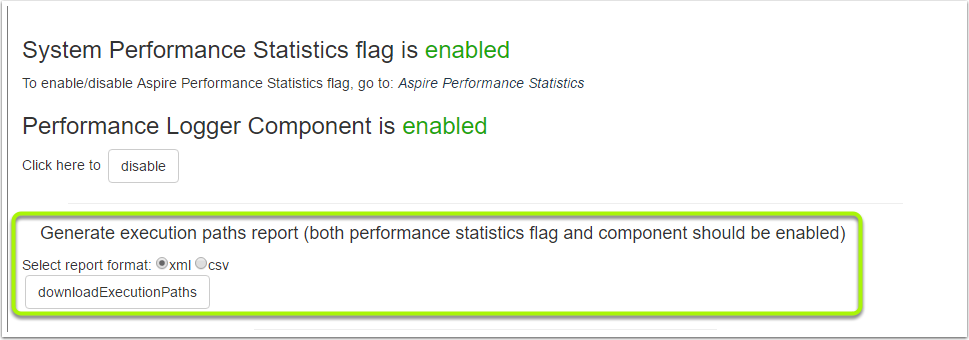
To download the reports generated by this component you need to go to the component's debug console page.
Once in the debug console page you can select the format of your choice to download the report, and then click on the button named "downloadExecutionPaths".
For more information about the Performance Logger go to Performance Logger.
Overview
Content Tools